app creation & cybernetic consulting


Intelligent Social Security System Atlas
Some socio-economic benchmarks of all states using available high dimensional data have been conducted.
All in all 31 indicators of economics, demography, population and sustainability have been used.
Four novel indicators setting national income and public debts in relation to the employment rate (common indicators are related to
the whole population size) have been defined.
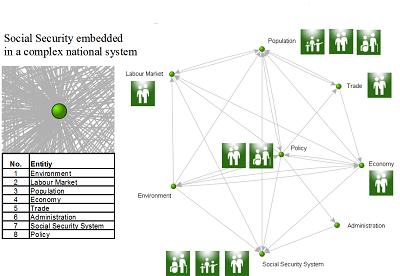
Furthermore an analysis of the Austrian social systems structure and its distribution keys (1985-2005) was also conducted with an artificial neural network (Self Organizing Map - SOM) for mapping historic developments
and similarities.
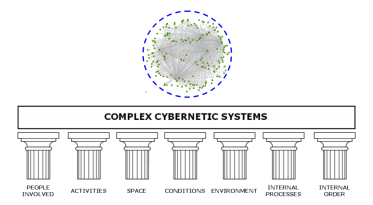
Frederic Vesters biocybernetic approach known as the "sensitivity model" was a guiding principle in raising up a global and a national approach for a model conisdering demographic change as well as different forms of economical debt.
An investigation of public data sources, indicators and the state of the art of todays public information systems
was made, leading to a concept and development of an early prototype for import, clustering, classification and visualization
using a self organizing map (SOM) which can be combined with state of the art Geographic Information Systems (GIS). Data was used from
The World Factbook 2010. Washington, DC: Central Intelligence Agency, 2010. and NationMaster.com.
These compendia include data from the World bank, national statistics, UNESCO, UNICEF, OECD, and others.
First studies on clustering of socio-economic data with SOMs have been made at the Technical University of Helsinki in the early 1990s. The resulting model is know as the
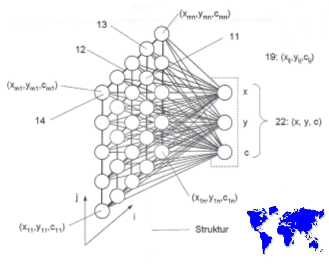
World Poverty Map. Now, about 20 years later the idea has been redeveloped with most recent data using. As you can see, a Self Organizing Map is a special class of Artificial Neural Network, which has its paradigm in the neo-cortex. Teuvo Kohonen, TU Helsinki, invented
the artificial neural pendent in the early 1980s.
High dimensional input is processed and clustered. On this basis ít is possible to make predictions and classifications. The graphic below shows such a neural layer which is fully interconnected
to a vector of neurons, acting as an input vector for high-dimensional measurements and estimates.
How can we interpret what is mapped during the learing process? The neural layer is a manifold, unifying patterns in 31 dimensions onto a two-dimensional map. Each dot represents a neuron which can have a certain activity state (e.g. within the range of observed states or depending on simulation data). We can isolate different data-dimensions on this high-dimensional manifold for visualizing neuron activity:
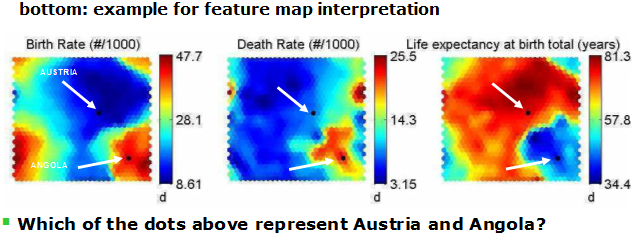
The first so called feature map represents global birth rate (blue regions = low rate, red regions = high rate). Analogue to this the map in the middel represents the global death rate, and
the map on the right the global life expectancy. Remember, the model has been calibrated on data of all nations there is data available from. So we can interpret that birth rate is globally mainly low and there
is about a quarter or less states which show a high birth rate. Death rate is alomost low in the worlds nations, but we can identify two clusters showing high death rate. The cluster on the lower right is larger then
the cluster in middle-right direction. Life expectancy is generally high and above about 65 years. There is one region where life expectancy is very low. When we combine all three feature maps we are able to go in further detail.
For instance, we have a small percentage of nations where birth rate is low, death rate is high, but life expectancy is also high. On the other side we have a bigger group of nations where birth rate is high, death rate is high
and life expectancy is low.
When we want to know the values of specific nations, we mark its high-dimenional data vector on the manifold with a black dot. In this example we
find two countries indicated: Angola and Austria.
Call for Publishers! This topic resulted in a study (2007, in german) and a monograph (2010, in english). A goal is to unify
the major contents of both books for a good introduction into public global data sources, modeling and prediction in respect to social security in times of economic crises. The overall
concept is related to the design of intelligent Information Systems for education, policy and strategy development